Data Visualization for ALL

The software lets you have fun with data!

The dots on the transparent globe show the area where someone is accessing the site from.

You can download the transparent globe's data on Excel after first downloading E2D3.

Download E2D3 FOR FREE

What is E2D3 you might ask?

E2D3 is an NPO that develops software for data visualization.
Our mission is to create a world where everyone can enjoy data!

What is Data Visualization?

It is to express numerical data in an easy to understand
and impressive manner by using graphs and diagrams.
There are lots of fun that you can operate on a computer,
move with animation, not on a handwritten graph!

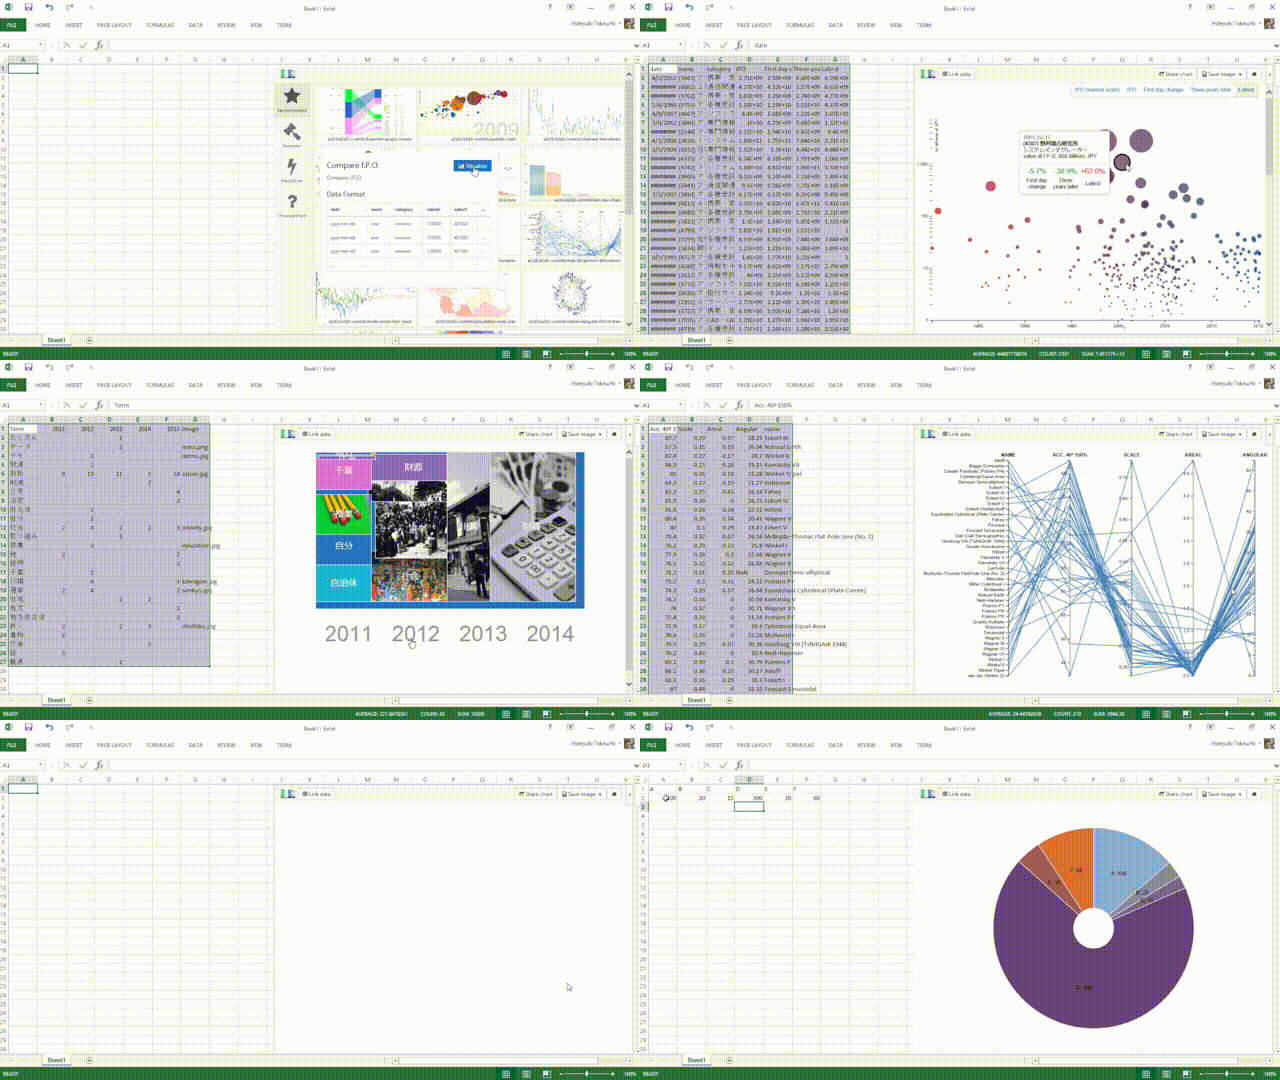
Use E2D3 on Excel

We create apps that you can utilize to make animated and intuitive graphs using your own data.

It is all completely free, regardless of whether you intend to use it for business purposes or for personal use.
It is also easy to use! The templates have default numbers, but you can change the numbers to whatever you desire. Just download E2D3 from Microsoft AppSource, open Microsoft Excel, and choose your favorite template. We provide over 80 templates!

Let's try E2D3!

“Footrace”

This template was created by a primary school student during a Hackathon. You can use the template to compare your speed to animals and track and field athletes.

You just have to enter your footrace speed and push the start button!

YOU a primary school Bolt Cheetah Typhoon Car(50km/h) Horse
Speed 17 Sec. 9.58 Sec. 3 Sec. 4 Sec. 7.2 Sec. 7.5 Sec.

“Dot Bar Chart”

When complicated data whose value changes every fiscal year is represented by a bar chart, it is necessary to create a graph for each fiscal year… it’s troublesome. Dot Bar Chart helps you! A dotted bar chart is transferred by clicks, and you can see the change of “every year” and “item by item” at the same time on one screen.

“Total number and trend of gold medals by country in each Olympics”

E2D3 on Excel

Donload FOR FREE

Data Visualization Made by Everyone

E2D3 holds workshops and Hackasson not only elementary school students and engineers, but also for wide range of other people. E2D3 engineers and designers present data in a way that stimulates innovation, and so believe “Properly presented data can be fun to work with".

A Mechanism to Keep E2D3 Growing

E2D3 is open source; one person's inspiration leads to another person’s inspiration, and the product grows. (The core part is released as OSS, anyone with programming knowledge can develop it.)

A case of collaborating with E2D3
Sep. 2016 NHK news web, US presidential election
Sep. 2016 Yahoo! news, Kumamoto earthquake seen from search data
Nov. 2014 Asahi Newspaper Digital, on the chart moving the House of Representatives election
Sep. 2012 withnews, House of Representatives election on graph

Events

Let’s Enjoy Data Visualization Together!

E2D3 not only shares software and the latest information, but also holds events through which everyone can learn and enjoy data visualization. We holds workshops, hackathons, and offer lectures given by guest speakers. It is not only for engineers and designers, but also for elementary school students, sales staff, housewives, university students; as such for people of all backgrounds.
If you are interested in data visualization, please feel free to join us!

過去のイベント

Looking For Development Members!

E2D3 is looking for development members. Would you like to participate in developments within your field of expertise such as engineering, UI/UX design, document composition, workshop facilitation, etc?